

Your invoices already know what your pricing is doing. Analytics is how you read them.
Pricing analytics is the practice of turning a company’s own transaction, customer, and market data into clear answers about what to charge, how much to discount, and where margin is being made or lost. It is what separates a pricebook built on evidence from one built on habit and the loudest voice in the room. For B2B companies, where prices are negotiated deal by deal and the real number is buried under discounts and concessions, pricing analytics is often the difference between knowing your pricing is working and merely hoping it is. This guide covers the metrics that matter most, the use cases where analytics pays off, and the benefits it delivers.
What pricing analytics tells you
At its core, pricing analytics answers a question most leadership teams cannot answer with confidence: what are we actually charging, and is it the right number? List prices are easy to see. The price that survives every discount, rebate, and concession is not, and neither is the pattern hiding across thousands of individual deals. Analytics makes both visible. It reads the history already sitting in your invoices and CRM and turns it into a picture of where price holds, where it erodes, and where customers would pay more without walking away.
Done well, it shifts pricing from an opinion to a measurement. Instead of debating whether a discount was necessary, you can see whether discounts of that size actually changed the outcome. Instead of guessing which customers are underpriced, you can rank them.
The metrics that matter most
A few core metrics carry most of the signal. Each one answers a specific question about how pricing is performing.
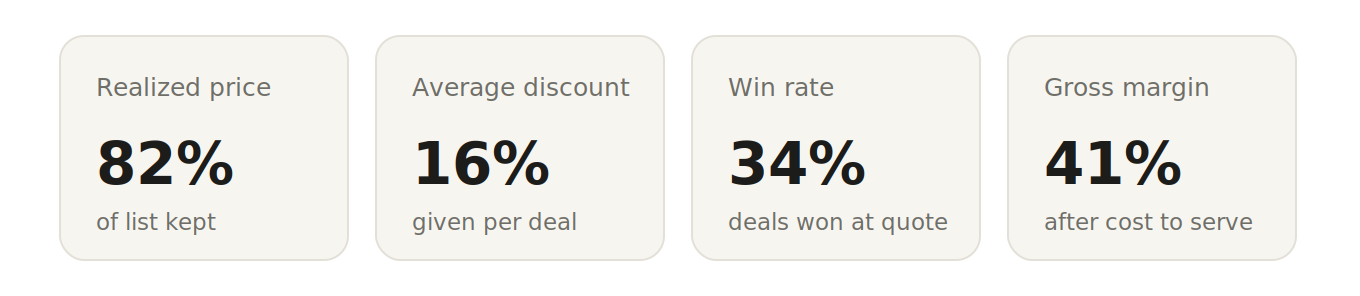
- Realized price: the share of list price you actually keep after every deduction, and the single clearest read on whether margin is leaking.
- Average discount: how much you give away on a typical deal, and whether that has crept upward over time.
- Price dispersion: how widely the same product’s price varies across similar customers, which is a direct measure of pricing inconsistency.
- Gross margin by segment: where you genuinely make money once cost to serve is included, and where you quietly do not.
- Win rate by price: how the odds of closing change as price rises, which reveals how much pricing power you really have.
- Net price trend: whether your realized price is climbing or eroding quarter over quarter, before it shows up in the annual numbers.
Consider a specialty chemicals manufacturer that was sure it held firm on price. Running pricing analytics across two years of invoices showed average realized price was 81 percent of list, and ranged from 70 percent in one region to 94 percent in another for the same grade of product. The list price was never the problem. The variance was. The analysis turned an invisible 24-point spread into a specific, region-by-region action list, which is the kind of finding no amount of intuition would have surfaced.
Pricing & growth expertise
Expert-led pricing & growth strategy for growth-focused and PE-backed companies.
Enterprise-quality work. Practical recommendations. 6-10 week timelines.
Where pricing analytics earns its keep
Metrics are only useful when they drive a decision. These are the use cases where pricing analytics consistently pays for itself.
Pricing the next increase with evidence
A blanket increase overshoots some accounts and leaves others untouched. Pricing analytics shows which accounts are underpriced relative to comparable peers and how much headroom exists before win rates start to move, so an increase can target the right accounts at the right size. The result is a sequence of defensible, account-level moves rather than one round number applied to everyone.
Scoring discounts and deals
Most discounting is granted on instinct. By analyzing which concessions actually changed an outcome, analytics separates the discounts that won a deal from the ones that simply handed away margin on a deal you would have won anyway. That insight becomes deal scoring and clear guardrails, so reps know before they negotiate what a good deal looks like.
Finding the price that maximizes revenue
Win rate falls as price rises, but the revenue from a deal is price multiplied by the odds of winning it, so the most profitable price is rarely the highest or the lowest. Pricing analytics estimates that relationship from your own history of wins and losses and points to the price that maximizes expected revenue.
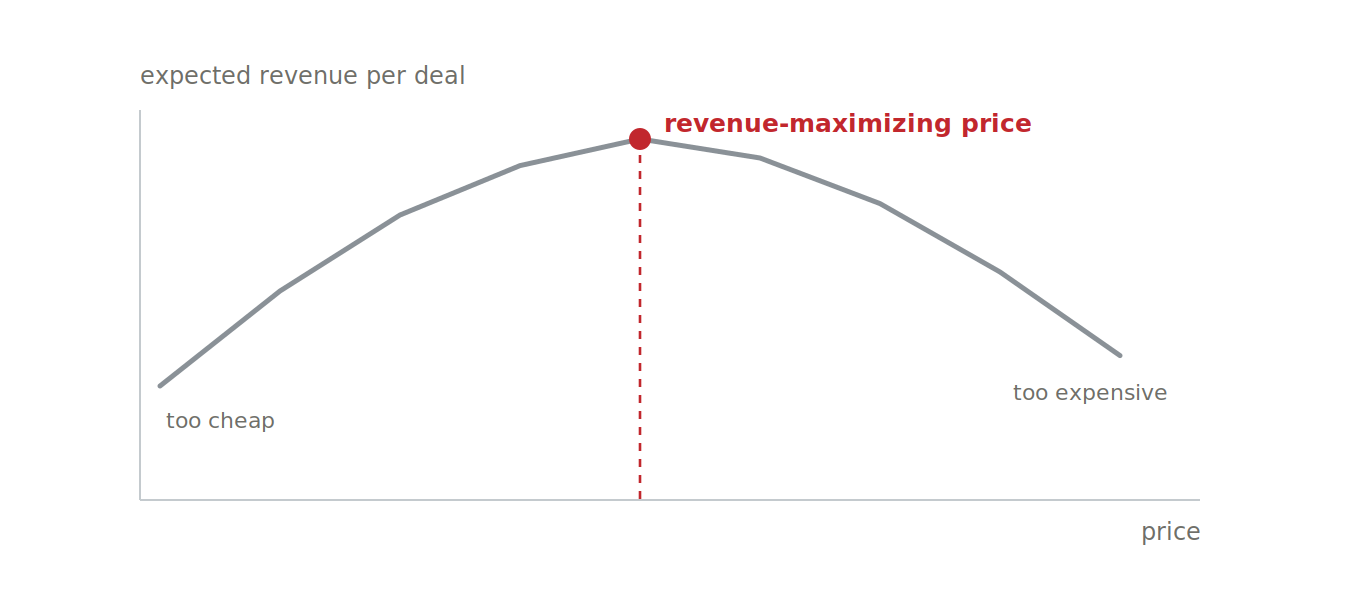
Take a commercial equipment rental company. Plotting win rate against daily rate across thousands of past quotes showed the close rate barely moved between $180 and $210 a day, then dropped sharply above $215. The company had been quoting around $185 to feel safe. The analysis showed that safe number was leaving roughly $25 a day on every winning quote, with almost no effect on whether it won the business.
Reading elasticity and segment differences
Sales intuition about price sensitivity is often backwards. Elasticity analysis measures how each segment actually responds to price, which frequently contradicts the assumption that the biggest, hardest-negotiating accounts are the most sensitive. A packaging supplier believed its largest enterprise customers would resist any increase, because they pushed hardest in negotiation. Analysis of past increases showed those accounts had absorbed every prior one with no measurable drop in volume. A targeted 6 percent increase on that segment held, and recovered margin the company had assumed was off the table.
What you gain from pricing analytics
The payoff from pricing analytics shows up on both the top and bottom lines, and in the quality of the decisions themselves.
- Protected margin: leakage and discount drift get caught and corrected before they compound across a full year of deals.
- Faster revenue growth: the willingness to pay you have been leaving on the table becomes visible and capturable.
- Confident decisions: pricing moves are backed by evidence rather than the most assertive opinion in the meeting.
- Consistency: sales gets clear, defensible guardrails, so similar customers stop paying very different prices.
- Early warning: realized price and discount trends surface in a dashboard month by month, not in a year-end surprise.
Getting started with pricing analytics
The first step is rarely a new system. It is making sense of the data you already have. Invoices, CRM win-and-loss records, and discount approvals usually hold most of the answers; they are simply scattered and unjoined. A focused pricing diagnostic pulls them together into a first clear view of realized price, dispersion, and leakage, which is enough to decide where the largest and fastest gains sit. From there, monitoring can become continuous, so the picture stays current as the business changes.
A clearer way to price
Pricing analytics does not replace judgment. It gives judgment something solid to stand on. By turning the data you already collect into a clear view of what you charge, what you keep, and what customers will bear, it lets a B2B company protect the margin it is owed and pursue the revenue it has been missing, with far less guesswork. The companies that price best are not the ones with the strongest opinions. They are the ones that can see their pricing clearly.
Your pricing answers are already in your data
The hard part is rarely a lack of information. It is that the answers are spread across invoices, quotes, and CRM records that were never built to be read together. Acustrategy helps B2B and PE-backed companies pull that data into a single clear view of where price and margin are moving, and our PricePro software keeps that view live once the strategy is set. If you want to see what your own pricing data can show you, we would be glad to take a look together. Reach out to us.
