
Your price list is only the first line of a longer calculation. Rebates, freight, payment terms, allowances, and credits all come off afterwards, and together they decide what each sale is actually worth. Revenue management consulting makes that calculation visible, assigns every line to someone, and turns the result into a monthly management routine.

Search for revenue management and most of what comes back is about hotels, airlines, and car rental. That discipline, usually called yield management, is built for perishable inventory: an empty room tonight is worth nothing tomorrow, so prices move with demand by the hour and the price is published for anyone to see.
B2B revenue management solves a different problem. Nothing perishes overnight, the price is negotiated rather than posted, and the money is lost after the price is agreed, in the terms and concessions that follow it.
| Hospitality yield management | B2B revenue management | |
|---|---|---|
| What is scarce | Rooms, seats, cars on a given date | Margin on contracted volume |
| How price is set | Published, changed by demand forecast | Negotiated per account, renewed per contract |
| Where revenue is lost | Unsold capacity, selling too cheap too early | Discounts, rebates, freight, terms, and credits after the deal |
| Main lever | Dynamic price and inventory controls | Rules for concessions, owners for each cost line, renewal pricing |
| Typical data | Booking curves, occupancy | Invoice lines, rebate accruals, freight bills, contract terms |
Everything on this page is about the right-hand column. If your business sells capacity by date, a yield management specialist is the better call.
The single most useful artifact in B2B revenue management is the price waterfall: a line-by-line walk from list price to pocket price, the amount the company keeps after every concession. It is simple to describe and rarely built, because its lines sit in four different systems.
Illustrative example. A distributor of industrial components, one product family, figures per $100 of list price.
| Waterfall line | Amount | Running price | Where the data usually sits |
|---|---|---|---|
| List price | $100.00 | Price book | |
| On-invoice discount (standard plus deal-specific), 12% | minus $12.00 | $88.00 | ERP invoice lines |
| Invoice price | $88.00 | ||
| Volume rebate, 3% of invoice | minus $2.64 | $85.36 | Rebate accrual spreadsheet |
| Freight absorbed on orders below the free-freight minimum | minus $3.50 | $81.86 | Freight bills, often in logistics |
| Co-op and marketing allowance | minus $1.00 | $80.86 | Marketing budget |
| Returns and credit notes | minus $1.20 | $79.66 | Customer service, credit memos |
| Cost of carrying net 90 terms instead of net 30 (60 extra days at an 8% cost of capital on $88) | minus $1.16 | $78.50 | Contract terms, treasury |
| Pocket price | $78.50 |
Three things come out of this table that the invoice alone never shows.
The off-invoice lines cost more than most people guess.
Between invoice and pocket price the company gives away a further $9.50, or 10.8% of invoiced revenue. In a business invoicing $40 million a year on this product family, that is about $4.3 million, spread across rebates ($1.2 million), freight ($1.6 million), allowances ($455,000), returns ($545,000), and payment terms ($526,000).
Several of the largest lines were never priced decisions.
Nobody negotiated $3.50 of free freight; it happened because the free-freight threshold was set years ago and small orders kept coming in under it. Nobody agreed to finance customers for 90 days; the terms crept out one renewal at a time. Neither appears on any discount report.
Small recoveries move margin a long way.
Suppose the business charges freight on half of the sub-minimum orders ($1.75 recovered), moves extended terms back to net 45 ($0.87 recovered), and cuts returns by a third with a clearer returns policy ($0.40 recovered). That is $3.02 per $100 of list, about $1.37 million a year, or 3.4% of invoiced revenue.
If product cost is $60 per $100 of list, those recoveries lift the margin left after product cost from $18.50 to $21.52 per unit, a 16.3% improvement, and not one price on the list has changed. That is why revenue management consulting usually pays for itself faster than a list price project. The money is already in the business; it is just leaving through lines nobody reviews.
Leakage persists because each line belongs to a different department and none of them is measured on pocket price. Part of every engagement is agreeing who owns which line, what control applies to it, and which number shows whether the control works.
| Waterfall line | Owner | Control | KPI reviewed monthly |
|---|---|---|---|
| On-invoice discount | Sales leadership | Discount bands and approval thresholds, reason codes | Average discount by rep and segment |
| Volume rebate | Finance with sales | Rebate tiers tied to verified volume, annual true-up | Rebate paid versus volume actually delivered |
| Freight | Operations with sales | Free-freight minimum, surcharge below it | Freight cost as a percentage of invoice |
| Allowances | Marketing | Allowances paid against agreed activity only | Allowance spend with proof of performance |
| Returns and credits | Customer service | Returns policy, credit note approval | Credits as a percentage of invoice |
| Payment terms | Finance | Standard terms, exceptions approved and dated | Days sales outstanding by account |
The owners do not need a new department to do this. They need the waterfall in front of them each month, their own line highlighted, and a standing slot in a meeting where the numbers are discussed. Where contract terms are the issue, tools such as a price escalation clause or pass-through pricing for volatile input costs give the owner something to negotiate with.
Pricing and revenue management often sit in separate teams. Pricing sets the number once a year; revenue management, if it exists at all, tries to defend it at quarter end. The gap between the two is where most of the waterfall above comes from. We join them into a single calendar, so each pricing decision is made with last period’s realization data and each realization review feeds the next pricing decision.
One hour, the waterfall by segment and channel, the five accounts with the largest gap between invoice and pocket price, and the exceptions granted that month with their reasons. Owners report on their own lines.
Every contract renewing in the next two quarters is reviewed against the current price rules, and every special pricing agreement due to expire is either renewed with a documented reason or allowed to lapse.
List prices, discount bands, rebate tiers, and the free-freight minimum are reset together, using a year of realization data rather than a cost-plus uplift. Reset one alone and the others quietly undo it.
The monthly review is the part companies skip, and the part that matters most. A waterfall built once and filed becomes a slide; a waterfall reviewed every month becomes a management habit.
If the answer to two or more of these is “we don’t know”, the waterfall above is probably understating your own leakage.
In contract businesses, most revenue next year comes from customers you already have, so a revenue management strategy is mostly a renewal strategy. The questions that decide it are specific.
Two engagements show the two halves of this work.
Realization. A global maker of premium industrial chemicals and equipment had little view of end-customer prices, because each distributor priced on its own and nobody at head office owned pricing. The first job was locating where margin escaped, by geography and channel. Research with end customers found a sharp regional divide in sensitivity: low in North America and Europe, high across Asia-Pacific. Pricing was rebuilt on value by region and segment, distributor terms and incentives were aligned, and escalation rules gave the new prices an owner. The client reported an 8% rise in price realization.
Compliance. A rigging hardware distributor, trading across 40-plus locations with a sales force of over 100, put branch-level price waterfalls and price floors in place across more than 110,000 SKUs, alongside new workflows and KPI dashboards. Reps were then paid on margin and new logos as well as revenue. Within the first year, the proportion of its transactions priced within approved rules climbed from below 40% to 77%. That is exactly the kind of number the monthly review above exists to move.
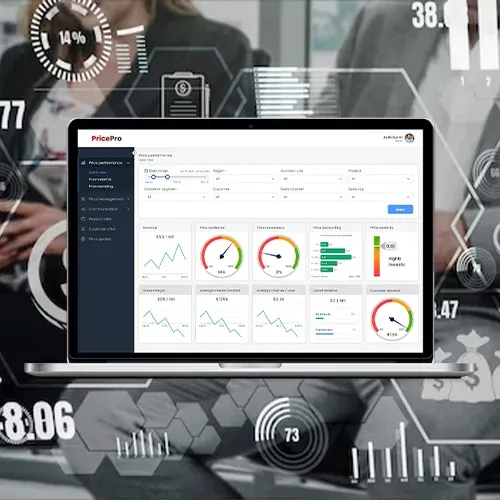
A waterfall assembled by hand from four systems is out of date the week it is finished. PricePro©, Acustrategy’s pricing platform, connects to the ERP, CRM, and quoting tools and keeps the numbers live: realization and discount effectiveness by segment, revenue leakage flagged as it appears, and approval workflows that apply the discount rules while a quote is still being built. It can run as a subscription for teams with their own pricing owner, or as a managed service where there is no one internally to run it.
The engagement itself is led by Acustrategy’s senior team, who have worked on pricing since 2008, and it typically runs six to 10 weeks before the monthly rhythm is handed to your owners.
Most B2B companies have never seen their list-to-pocket walk for a single product family. Talk to us about building one from your own invoice and rebate data and finding which lines are worth fixing first.
Twelve months of invoice lines at minimum, 24 ideally, plus rebate accruals, freight costs, credit notes, and contract terms. Invoice data is usually clean; the off-invoice lines rarely are, and we reconcile them. Unattributable costs are allocated by a stated rule, so nobody mistakes an estimate for a fact.
No. The waterfall is most revealing in mid-market companies, where the off-invoice lines have grown without a dedicated pricing team watching them. A business with a few hundred accounts and a single ERP can have a working waterfall within the first weeks.
Gross margin is usually calculated on invoice price, so it misses rebates, freight, allowances, and terms that are booked elsewhere. Two accounts with the same gross margin can have very different pocket margins. The waterfall shows the difference account by account.
Pricing decides what a customer should pay. Revenue management makes sure the amount survives everything that happens after the price is agreed, from rebates to returns. We treat them as one cycle because the realization data from the second is the best evidence for the first.
Sometimes, so each change is sized first. Freight minimums and terms are rarely why a customer chose you, and most accept a clear policy applied to everyone. The accounts most likely to object often carry the largest hidden subsidies, and they are handled one by one at renewal, not by blanket letter.
It adds a view finance rarely has: price realization by account, segment, and channel, built from lines that sit in different ledgers. Finance usually becomes the owner of the monthly waterfall once it exists. No existing report is replaced; the waterfall sits alongside them.
