
“They are 15% cheaper” is the most expensive sentence in B2B sales, because it is usually repeated before anyone has checked it. We build competitive pricing analysis from evidence that holds up: normalized quotes, sources ranked by reliability, and a read on where your price position actually wins and loses deals.


In B2B markets competitor prices are rarely published, and when they are, they are list prices nobody pays. What reaches your sales team is a number: a figure the buyer quoted, a line from a lost-deal note, a price a distributor mentioned. That number arrives without its terms.
A competitor unit price means little on its own. The buyer’s real cost includes who pays freight, how long they have to pay, the minimum order they must take, what happens when the product fails, and what installation or support costs extra. Two quotes can differ by 15% on the unit price and be level, or reversed, once those are counted.
This matters because the unnormalized number drives decisions. Reps discount to match it, managers approve the discount because the competitor claim sounds specific, and over a year the claim becomes the market price in your own ledger. Competitive pricing analysis exists to put the terms back on the number before anyone reacts to it.
A buyer needs 4,000 units a year, ordered quarterly. Your quote is $95 a unit, delivered, on 60-day payment terms, with a three-year warranty and commissioning included. The competitor’s quote is $82 a unit, which the buyer presents as a 13.7% saving on your price. Your rep reports it the other way round: “we are 16% more expensive”, the same $13 gap measured from the competitor’s price.
Adjust both to the buyer’s effective cost per unit:
| Cost element | Competitor | Your offer | Working |
|---|---|---|---|
| Quoted unit price | $82.00 | $95.00 | As quoted, before any terms |
| Freight | +$6.50 | Included | Competitor ships ex-works; buyer’s freight cost per unit |
| Minimum order | +$2.05 | None | 500 extra units x $82 x 20% carrying cost / 4,000 units |
| Warranty gap | +$4.40 | Covered | 4% expected failure in years two and three x $110 |
| Commissioning | +$3.00 | Included | Charged separately by the competitor |
| Payment terms | Net 30 | -$0.62 | Extra 30 days: $95 x 8% cost of capital x 30 / 365 |
| Effective cost per unit | $97.95 | $94.38 | Sum of the lines above |
Two lines need a word of explanation. The competitor’s 2,000-unit minimum doubles the buyer’s average stock from 500 to 1,000 units, and carrying the extra 500 at a 20% annual rate costs $8,200 a year. And its warranty covers one year against your three, with each later failure costing $110 in replacement and labor.
On a like-for-like basis your offer is about 3.6% cheaper than the competitor, not 16% more expensive. The right response to the “16% more expensive” claim is not a discount. It is this table, rebuilt with the buyer’s own freight and carrying costs, put in front of the buyer before the next negotiation round.
Normalization does not always favor you. Sometimes the competitor genuinely is cheaper once terms are counted, and then the question moves to whether your differentiation justifies the gap. That is a value question, and the method for answering it is on our value based pricing page.
Competitor pricing research draws on many sources, and they are not equally trustworthy. We grade each one and weight the analysis accordingly.
| Source | What it tells you | Reliability | Main bias |
|---|---|---|---|
| Public tender and contract award records | Actual contracted prices in public-sector deals | High for those deals | May not reflect private-sector terms |
| Customer-shared quotes, given freely | A real offer with its terms | High | Buyers share selectively, often the lowest line |
| Published price lists and web stores | List and online prices, with history if tracked | High for list, low for net | B2B net prices sit well below list |
| Distributor and reseller price lists | Channel pricing and margin structure | Medium to high | Varies by distributor and date |
| Win and loss interviews | Why a deal was lost and what the winner offered | Medium | Buyers exaggerate price to explain a decision |
| CRM win and loss data with price position | Patterns across many deals | Medium to high if fields are filled | Only as good as the reason codes |
| Public competitors’ financial filings | Margin and pricing direction over time | Medium | Company-wide, not product-level |
| Rep-reported competitor prices | Fast, frequent signals | Low | Reps benefit from a low competitor price |
Two rules follow. A single low-reliability source never justifies a price change on its own; it triggers a check against a higher rung. And every rep-reported price is logged with the deal, so the claim can be compared with what the buyer later shares or with the outcome.
Knowing competitor prices is only useful once you know how your price position affects whether you win. That requires joining price benchmarking to your own deal outcomes.
180 competitive deals from the last year, grouped by how the final price compared with the best-known competitor offer after normalization:
| Your price versus the competitor | Deals | Won | Win rate |
|---|---|---|---|
| More than 10% above | 50 | 11 | 22% |
| Within 10% either way | 90 | 37 | 41% |
| More than 10% below | 40 | 19 | 48% |
The readings:
Inside the 10% band, price is not deciding most deals.
Going more than 10% below the competitor lifts the win rate only from 41% to 48%, while giving away over 10% on every such deal. Unless margins are very high, that trade loses money.
Above 10%, price starts to bite.
The win rate halves. Either the value story is not landing with these buyers, or these are segments where the offer is simply priced out. Splitting the 50 deals by segment usually tells you which.
The band is the finding.
The width of the zone where price barely moves win rate is your practical pricing room; here it runs from 10% below the competitor to 10% above. It feeds the price corridors and discount rules on our price optimization work.
Competitive benchmarking beyond price, such as service levels, lead times, and contract terms, belongs in the same analysis, because those are the attributes that let you sit at the top of the band and still win.
The output is designed to change decisions, not to fill a folder.
Three client engagements show the range of what the work finds.
A rigging hardware distributor had inconsistent pricing across more than 110,000 SKUs, 40 locations, and 100 salespeople. The new pricing structure used automated reading of supplier catalogs and web scraping for competitor price intelligence, feeding branch-level price waterfalls. Together with the governance work around it, gross margin rose 8.1% over the first year, on the client’s figures.
An IV therapy clinic chain, a consumer services business entering new metros, had inconsistent prices across locations and bundles customers found confusing. The competitive scan covered direct competitors and substitute services: spas, urgent care, and wellness clinics. That wider frame informed three membership tiers and a repriced à la carte menu. On the client’s numbers, attachment climbed 20% and each visit brought in 15% more revenue on average.
A residential pest control company, also consumer services, benchmarked competitors including their monthly plans and bundles, not only one-off visit prices. Together with homeowner research, the work showed untapped demand for bundles; the resulting three-tier subscription offer with add-ons drove, as the client reported, a 28% increase in subscription adoption.
The common thread is that the competitive set was wider, and the comparison more complete, than the client’s own view of it.
A benchmark taken once is out of date within a quarter in most markets. We set a cadence that matches how fast your market moves: a monthly refresh where web prices and catalogs change often, quarterly where contracts dominate, and an event trigger for any competitor launch, acquisition, or published price change.
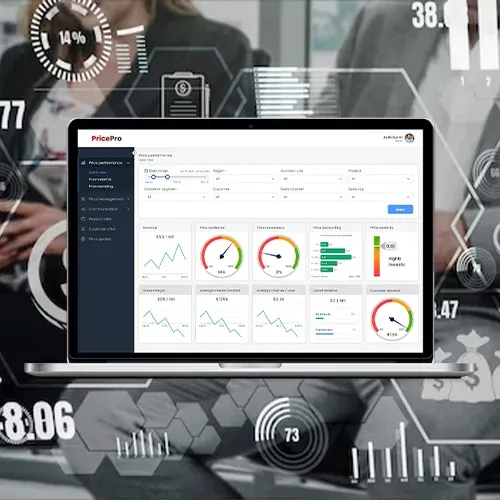
Where the monitoring needs to run continuously, PricePro© tracks competitive pricing and market movement, raises alerts on shifts and anomalies, and sets the market read beside your own deal data, so a competitor move is visible in the same place the next quote is priced. The platform is optional; the discipline of grading sources and normalizing quotes is not.
A published cut from a rival is the moment most pricing discipline breaks, because every rep wants cover for the next deal. A short sequence keeps the response deliberate.
Establish what actually changed. List price, net price, a promotion, or a new entry-level offer? Many announced cuts apply to a narrow product or a new-customer promotion.
Normalize the new price against yours, using the same model as the worked example above. A cut paired with stricter terms may be no cut at all.
Size the exposure. Which accounts buy the affected products, what share of revenue they represent, and how many sit in the segments your win-rate analysis shows are sensitive.
Choose a response by segment. Hold price where your position is strong, offer a leaner option where buyers are price-led, and match only where accounts at risk outweigh the margin given up.
Set an expiry and review date on any concession, so a temporary answer does not become the new floor. The review checks whether the rival’s cut actually held.
Send us a recent competitive quote with the terms you know. We will show you what it looks like normalized against yours, and what that says about the discount your team was about to give.
Competitive intelligence covers everything about rivals: products, positioning, hiring, strategy. Competitive pricing analysis is the part that changes what you charge: where your price sits against the alternatives a buyer weighs, after terms are normalized, and how that position affects win rates.
Log every competitor price claim with the deal, its source, and the terms if known. Within a quarter you can compare claims with prices buyers actually share and with deal outcomes. In most datasets a meaningful share of claims do not survive normalization.
You can accept what customers choose to share, and many will share a competing offer to negotiate. Do not solicit quotes the customer received under a confidentiality obligation, and do not use a customer as a channel to learn a competitor’s future pricing.
It depends on how prices move in your market. Web-sold and catalog products may need monthly checks; contract-driven markets may need quarterly reviews plus an immediate review when a competitor announces a change. The source register dates every price, so stale ones show.
Collecting publicly displayed prices is common practice, but the rules vary by site terms and jurisdiction, and some sites prohibit automated collection. We agree the approach with you and your counsel before any scraping is set up.
Then you learned it from evidence, not a lost deal. Next, decide whether to close the gap with price, a leaner offer for price-sensitive segments, or a stronger value case. Our pricing and packaging work often builds the leaner offer without cutting the main price.
